Interpretable Reward Redistribution in Reinforcement Learning: A Causal Approach

Eindhoven University of Technology, King's College London, University of California San Diego, University College London, University of Liverpool
NeurIPS 2023

Abstract

A major challenge in reinforcement learning is to determine which state-action pairs are responsible for future rewards that are delayed. Reward redistribution serves as a solution to re-assign credits for each time step from observed sequences. While the majority of current approaches construct the reward redistribution in an uninterpretable manner, we propose to explicitly model the contributions of state and action from a causal perspective, resulting in an interpretable reward redistribution and preserving policy invariance. In this paper, we start by studying the role of causal generative models in reward redistribution by characterizing the generation of Markovian rewards and trajectory-wise long-term return and further propose a framework, called Generative Return Decomposition (GRD), for policy optimization in delayed reward scenarios. Specifically, GRD first identifies the unobservable Markovian rewards and causal relations in the generative process. Then, GRD makes use of the identified causal generative model to form a compact representation to train policy over the most favorable subspace of the state space of the agent. Theoretically, we show that the unobservable Markovian reward function is identifiable, as well as the underlying causal structure and causal models. Experimental results show that our method outperforms state-of-the-art methods and the provided visualization further demonstrates the interpretability of our method.

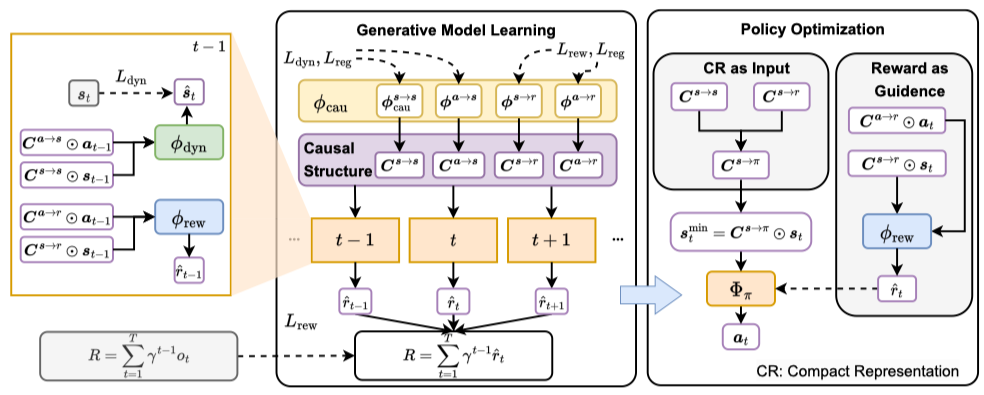
A Causal Reformulation of Reward Redistribution

Causal Graph

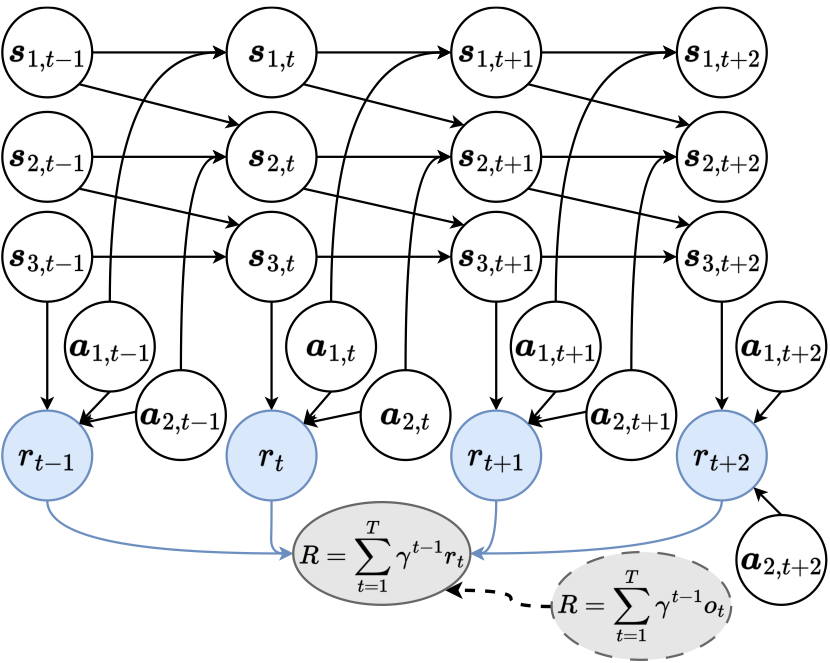
Figure 1 shows the causal relationship among environmental variables. The nodes denote different variables in the MDP environment, i.e., all dimensions of state \(\boldsymbol s_{\cdot, t}\) and action \(\boldsymbol a_{\cdot, {t}}\), Markovian rewards \(r_{t}\) for \(t\in[1, T]\), as well as the long-term return \(R\). For sparse reward settings in RL, the Markovian rewards \(r_t\) are unobservable, which are represented by nodes with blue filling. While considering the return-equivalent assumption in return decomposition, we can observe the trajectory-wise long-term return, \(R\), which equals the discounted sum of delayed reward \(o_t\) and evaluates the performance of the agent within the whole episode. A special case of delayed rewards is in episodic RL, where \(o_{1:T-1} = 0\) and \(o_T \neq 0\).

Generative Return Decomposition

Causal Graph

Figure 2: The framework of the proposed GRD. \(\phi_{\text{cau}}\), \(\phi_{\text{rew}}\), \(\phi_{\text{dyn}}\) in generative model \(\Phi_{\text{m}}\) are marked as yellow, blue and green, while policy model \(\Phi_{\pi}\) is marked as orange. The observable variables, state \(\boldsymbol s_t\), action \(\boldsymbol a_t\), and the delayed reward \(o_t\), are marked as gray. The mediate results, binary masks, \(\boldsymbol{C}^{\cdot \rightarrow \cdot}\), outputs of policy, the predicted Markovian rewards \(\hat{r}_t\) and the compact representation \(\boldsymbol{s}^{\text{min}}_t\) are denoted as purple squares.

Experimental Results

Causal Graph

Main Results: : Learning curves on a suite of MuJoCo benchmark tasks with episodic rewards, based on \(5\) independent runs with random initialization. The shaded region indicates the standard deviation and the curves were smoothed by averaging the 10 most recent evaluation points using an exponential moving average. An evaluation point was established every \(10^4\) time steps.


Causal Graph

Visualization of Learned Causal Structure: : The visualization of learned causal structure for Ant when \(t\in [1e4, 5e5, 1e6]\). The color indicates the probability of the existence of causal edges, whereas darker colors represent higher probabilities. There are \(111\) dimensions in the state variables, but only the first \(27\) ones are used. (a) The learned causal structure among the first \(27\) dimensions of the state variable \(\boldsymbol{s}_t\) to the first \(54\) dimensions of the next state variable \(\boldsymbol{s}_{t+1}\). Due to the limited space, we only visualize the structure at \(t=1e4\) and \(t=1e6\). (b) The learned causal structure among all dimensions of the action variable \(\boldsymbol{a}_t\) to the first \(54\) dimensions of the next state variable \(\boldsymbol{s}_{t+1}\). (c) The learned causal structure among the first \(54\) dimensions of the state variable \(\boldsymbol{s}_t\) to the Markovian reward variable \(r_t\). (d) The learned causal structure among all dimensions of action variable \(\boldsymbol{a}_t\) to the Markovian reward variable \(r_t\).


Causal Graph

Evaluation with Gaussian Noise in the State (Ant): A significant characteristic of Ant is that only the first \(28\) dimensions of state are used. During policy evaluation, we introduce the independent Gaussian noises with the mean of \(0\) and standard deviation of \(0 \sim 1\) into those insignificant dimensions (\(28 \sim 111\)).


Causal Graph

Visualization of Decomposed Rewards (blue) and Ground Truth Rewards (red).

BibTeX


        @inproceedings{
          grd_neurips2023,
          title={Interpretable Reward Redistribution in Reinforcement Learning: A Causal Approach},
          author={Yudi Zhang, Yali Du, Biwei Huang, Ziyan Wang, Jun Wang, Meng Fang and Mykola Pechenizkiy},
          booktitle={Thirty-seventh Conference on Neural Information Processing Systems},
          year={2023},
          url={https://openreview.net/forum?id=w7TyuWhGZP}
          }